Solar installations on rooftops
Photovoltaics for industrial halls
Reduce energy costs and increase your operation's energy independence
Benefits of photovoltaics for companies
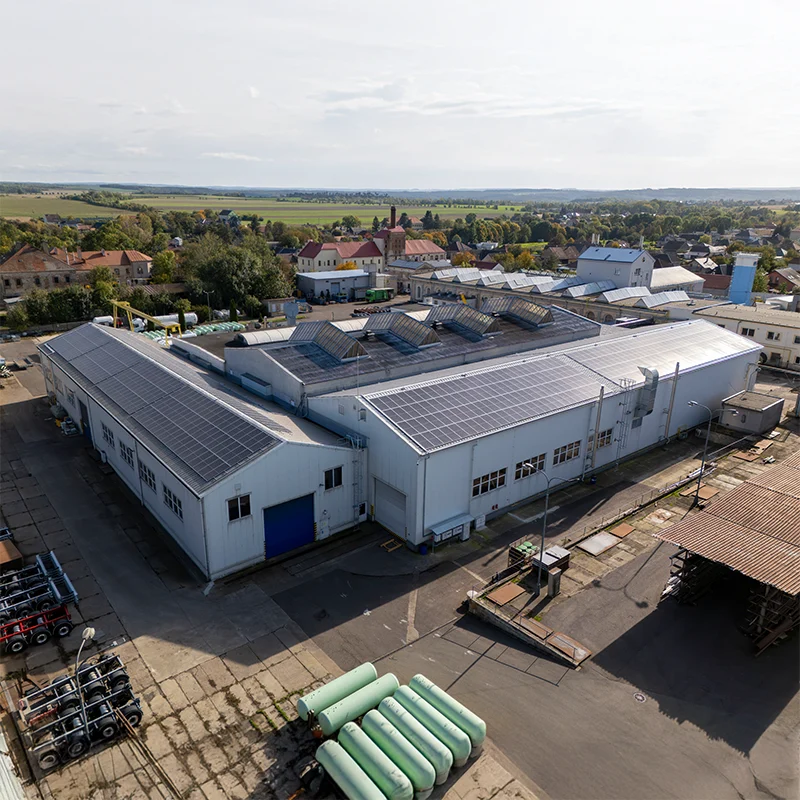
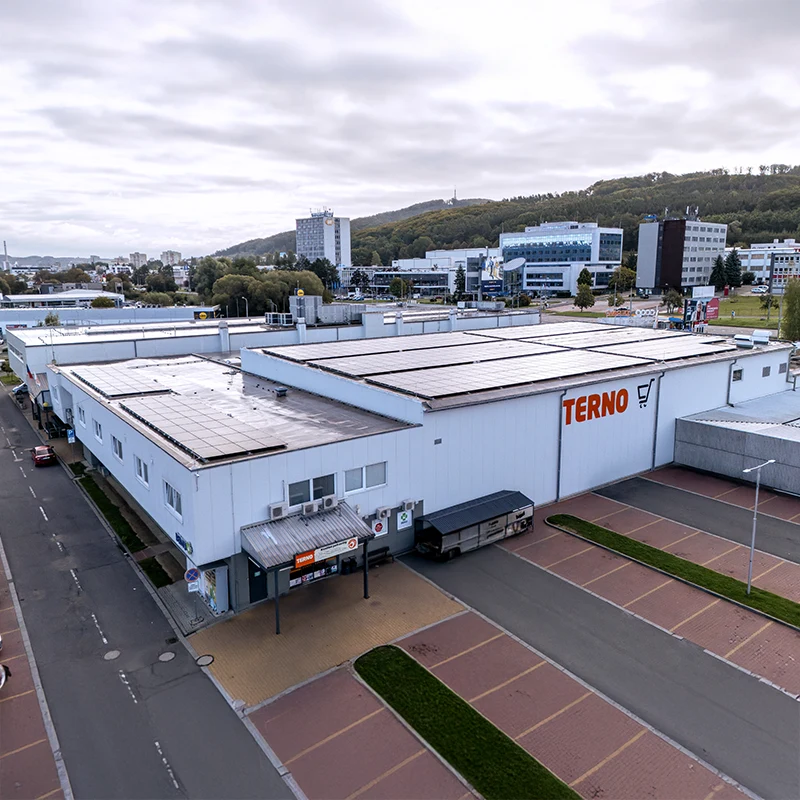
Industrial and warehouse halls represent ideal spaces for photovoltaic power plant installations.
Large roof areas, high electricity consumption and regular daily operations ensure optimal conditions for maximum utilization of generated energy.


Photovoltaics for companies
Specialized solutions for industrial facilities
For industrial facilities, we also implement more demanding projects: flexi panels weighing 5 kg/m² for roofs with poorer statics, in-house manufactured carports for parking lot roofing, and custom mounting systems according to client requirements.
Special applications
Solar carports
We offer efficient parking space roofing with integrated photovoltaic panels - an elegant dual-purpose solution.

Complete solutions
What's included in the offer
We take care of the entire photovoltaic power plant project – from initial consumption analysis to long-term service.
We handle all technical and administrative aspects of implementation.

How PV implementation proceeds from start to finish
A simple overview of the steps awaiting you on the path to your own photovoltaic power plant.
Consumption analysis
Optimal solution design
Engineering documentation
Grant arrangement
Building permit processing
Professional installation
Grid connection
Service, monitoring and long-term support

Photovoltaic Revenues by Month
The displayed values represent model monthly production of a 100 kWp PV system typical for rooftop installations on industrial halls.
The annual total amounts to ≈ 97 MWh (close to the assumption of 100 MWh/year).
Production has normal seasonality – most energy produced in June–August, least in winter; this is reflected in the share of consumption coverage in individual months.
The column named "Energy production" indicates the amount of electricity produced (energy) in kWh. The column named "Total revenue" means the financial benefit from savings due to utilization of produced electricity at the point of consumption and from the sale of surpluses.

Resulting annual financial benefit
Savings from self-consumption of produced electricity:
97 × 0.8 = 77.6 MWh × 4,500 = 349,200 CZK
Sale of surpluses to the grid:
97 × 0.2 = 19.4 MWh × 1,000 = 19,400 CZK
Total annual revenue from the PV system is approximately 368,600 CZK/year
Actual results may vary according to the real current electricity price, share of self-consumption, and feed-in conditions.
How to read the seasonality
Highest production is in summer, when the PV system covers the largest share of your consumption; in winter, production is lower. If you have technologies (*load curve) with higher summer demand (e.g., cooling, irrigation, part of production operations, or fleet charging), the actual utilization of self-produced electricity is typically even higher.
Better utilization thanks to storage
Battery storage increases the share of produced electricity utilized on-site typically from ~80% to 90–95%. This means fewer low-value exports to the grid and more savings thanks to your own energy even in the evening and at night.
kWh
Graph of projected electricity production throughout the year.
14000
12000
10000
8000
6000
4000
2000
0
Our implementations
Successful PV projects in industrial facilities
We have implemented dozens of projects for industrial facilities of various sizes throughout the Czech Republic and abroad.
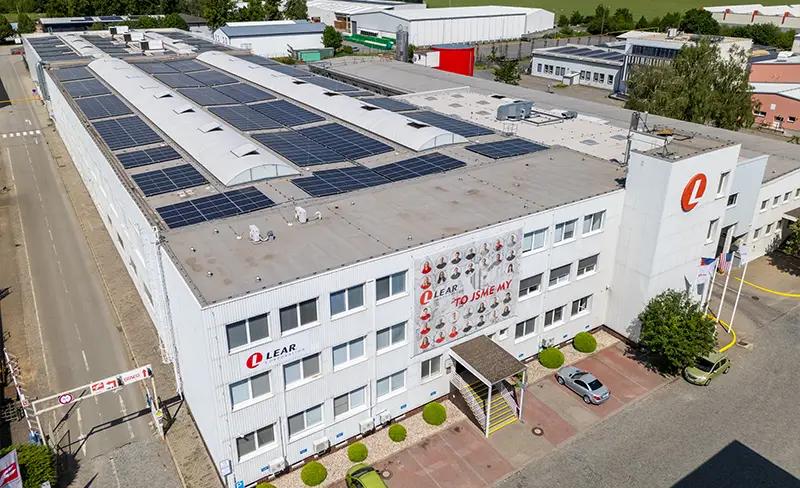
Photovoltaic power plant for the Lear Corporation manufacturing facility in Vyškov
Solar power plant on both the hall roof and the ground reduces the facility's energy intensity. Turnkey general contracting from earthworks to commissioning in 2026.
Rooftop Photovoltaic Power Plant at STAVEBNÍ FIRMA PLUS Headquarters in Hodonín
In summer 2025, we installed a 49.5 kWp PV system on the 300 m² rooftop of a construction company's headquarters in Hodonín.
Photovoltaic power plant installation in Břeclav in 2025
We installed a PV system with battery storage on the roof of the VHS Břeclav building to power the workshops, office air conditioning, and electric vehicle charging.

Solar energy for gas engineering plants in Rosice
We implemented an extensive 530 kWp photovoltaic power plant on five roofs of East Bohemian Gas Engineering Plants.

Two photovoltaic power plants for Pekárny Moravec facilities in Moravská Třebová
In 2022, we implemented two PV systems for Pekárny Moravec, each with 54 kWp capacity. They are installed on buildings in two locations. The system provides clean electricity for bakery production.

Photovoltaic power plant with battery storage for Harmonikas facility in Louny
Photovoltaic power plant with storage - energy independence for Harmonikas manufacturing facility.

Rooftop photovoltaic power plant in Kunovice
The third phase of photovoltaic power plant implementation for BRM AERO.

Photovoltaic power plant at BRM AERO facility in Kunovice
Implementation of the second phase of photovoltaic power plant construction at BRM AERO facility in 2023.
.webp)
Photovoltaic power plant with storage on operational building roof in Kunovice
Installation of 99.56 kWp photovoltaic power plant on operational building roof at BRM AERO facility.

Photovoltaic power plant in industrial facility in Sezimovo Ústí
We installed a 613.64 kWp photovoltaic power plant in the industrial facility in Sezimovo Ústí.

Solar power plant on KOVO - Mazánek hall roof in Tatobity
In 2023, we installed a photovoltaic power plant on the hall roof at KOVO - Mazánek s.r.o. facility in Tatobity.
Photovoltaic power plant on shopping center roof in Zlín
In 2023, we installed a photovoltaic power plant on a shopping center roof in Zlín.

Photovoltaic power plant for new Munters Czech headquarters in Hodonín
Construction of photovoltaic power plant at Munters Czech s.r.o. industrial facility - Kapřiska site in 2022 and 2023.

Photovoltaic solution for Filák industrial facility
We installed a 299.82 kWp photovoltaic power plant on the industrial hall roof at Filák facility in Vlkoš.

Solar energy for plastic processing industrial facility in Kelčany
Implementation of the second phase of photovoltaic power plant on the roof at LUVE-PLAST industrial facility.

PV for Moravia Cans industrial facility in Bojkovice
As part of the project for Moravia Cans industrial facility, a 299.92 kWp photovoltaic power plant was successfully installed.

Photovoltaic power plant on carpentry workshop roof in Hranice
In 2024, we installed a photovoltaic power plant on the roof at Santo Carpentry facility. This project was fully financed from the investor's own resources.
Articles
More interesting topics
Solar power plant insights: options, tips, news and our procedures.

